Consumption Graph
Once you have added a submeter you are able to view the consumption graph.
See the following article on how to do this: How can I improve the Smappee planner?
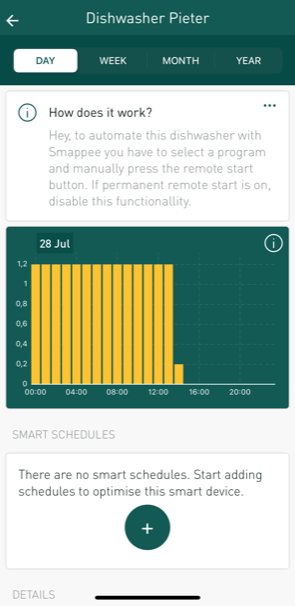
The consumption graph allows you to switch between week/month/year.
Swiping left or right lets you navigate through different periods.
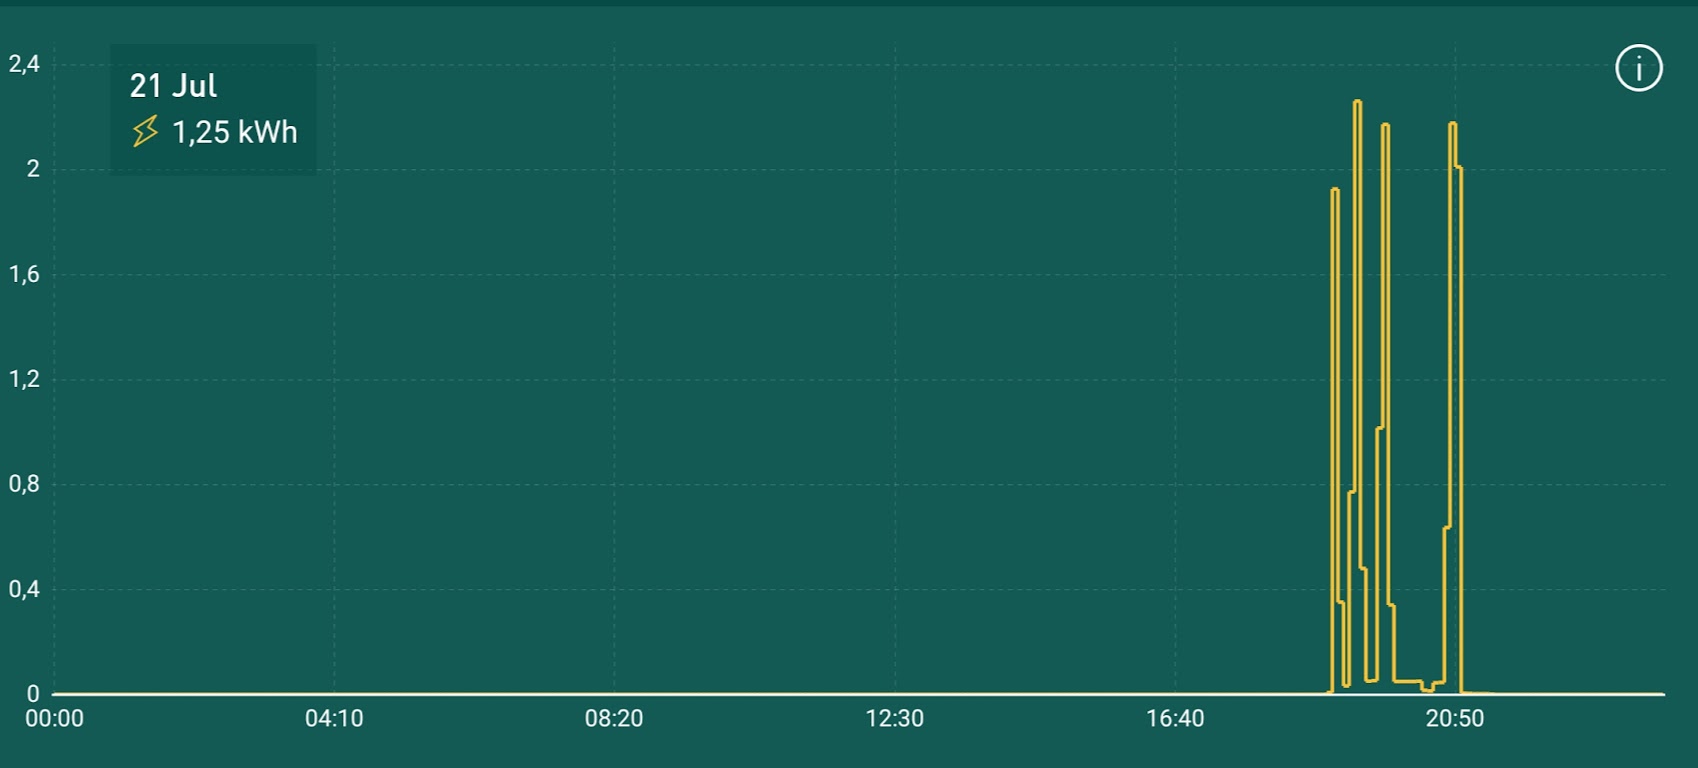
Holding your phone horizontally will make the graph switch to landscape mode, showing more details of the consumption.